Data Visualization
How to Visually Inspect Individual Variables
This lecture focuses on how we can visually inspect individual variables using bar charts or histograms. To be clear, this means we are looking at ONE variable at a time. The purpose of descriptive statistics is to determine the type of data we have, not to draw conclusions about our hypotheses (which would require inspecting at least TWO variables in one chart. Understanding the type of data you have determines how you can visualize it.
| Graph | Purpose | Data Type |
|---|---|---|
| Bar Graph | For a single variable, a bar graph displays categorical variables. It shows how many times each category of that variable occured in a dataset. Each bar represents a category, and the height of the bar represents the number of observations (typically, this is the number of participants). | Categorical Data |
| Histogram | For a single variable, this is a graph that displays numerical data. Because numerical data has many points along a scale, the histgram must create it's own bars to visualize the data. Histograms group values along the scale into ranges called "bins." The histogram show how many observations fall within each bin. | Continuous Data |
Bar Graphs
- Used for categorical data (nominal and ordinal).
- Used to compare values between groups.
- Each bar represents a separate category.
- Bars do not touch because categories are separate.
- X-axis: Categories
- Y-axis: Frequency or value
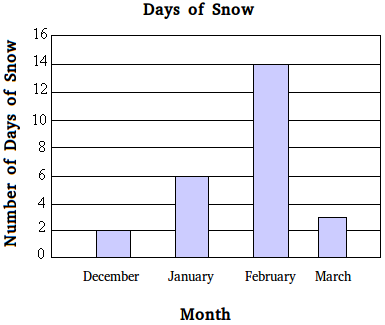
Below is an example of a bar graph:
Histograms
- Used for continuous data (interval and ratio).
- Used to examine the distribution and normality of data.
- Should be created for continuous variables.
- Bars touch because values represent continuous ranges.
- X-axis: Ranges of values (bins)
- Y-axis: Frequency
Checking Normality
Inferential statistics are used to determine whether evidence supports the null or alternative hypothesis. The inferential test selected depends on whether continuous variables are normally distributed.
Failing to examine data distribution can lead to incorrect statistical test selection and inaccurate conclusions.
Normality only applies to continuous data. Categorical variables (nominal and ordinal data) do not have a normal distribution.Normal Distribution
A normal distribution occurs when continuous data follow a predictable mathematical pattern.
Key characteristics of an approximately normal distribution:
- Mean, median, and mode are similar: The three measures of central tendency occur near the center of the distribution.
- Symmetry: The left and right sides of the distribution are approximately mirror images.
- Bell-shaped curve: Most observations cluster near the center, with fewer observations occurring at extreme values.

Skewness
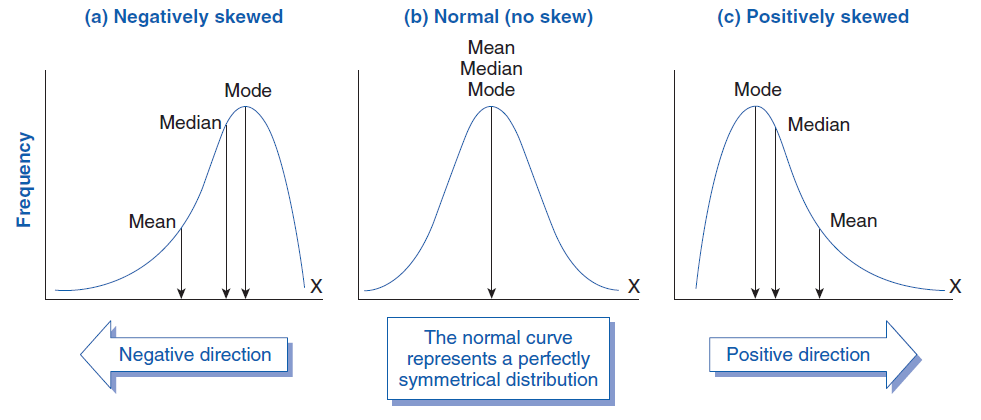
A distribution is symmetrical when each side is a mirror image of the other. When data are not symmetrical, the distribution is considered skewed.
Positive Skewness (Right Skew)
- The tail extends toward the right side of the distribution.
- Most observations are concentrated on the left side.
Negative Skewness (Left Skew)
- The tail extends toward the left side of the distribution.
- Most observations are concentrated on the right side.