Interpreting Scatterplots
Overview
A scatterplot is used to examine the relationship between two quantitative variables. Each point represents one observation, with one variable plotted on the x-axis and the other variable plotted on the y-axis.
Step 1: Look at the Form
First, look at the overall shape of the points. The relationship may follow a relatively straight pattern or may follow a curved pattern.
| Form | What to Look For | What It Means |
|---|---|---|
| Linear | The points generally follow a straight-line pattern. | The relationship can be reasonably described by a straight line. |
| Curvilinear | The points follow a noticeable curve rather than a straight line. | The relationship changes direction or rate as one variable increases. |

Step 2: Look at the Direction
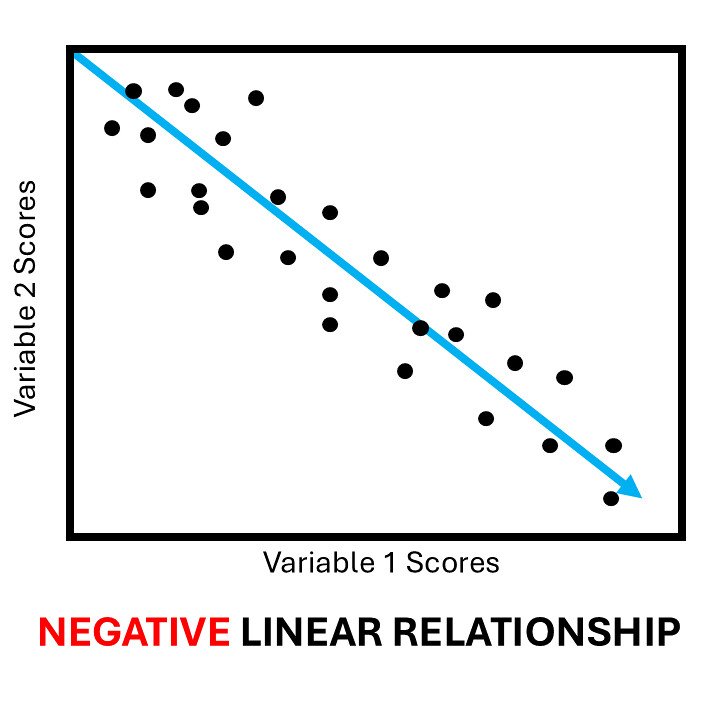
If the relationship is linear, determine whether the variables move in the same direction or in opposite directions.
| Direction | What to Look For | Interpretation |
|---|---|---|
| Positive | As one variable increases, the other variable increases. | The variables move in the same direction. |
| Negative | As one variable increases, the other variable decreases. | The variables move in opposite directions. |
| No Relationship | The points do not show a consistent pattern. | Knowing one variable does not provide much information about the other variable. |
Direction Examples

Step 3: Look at the Strength
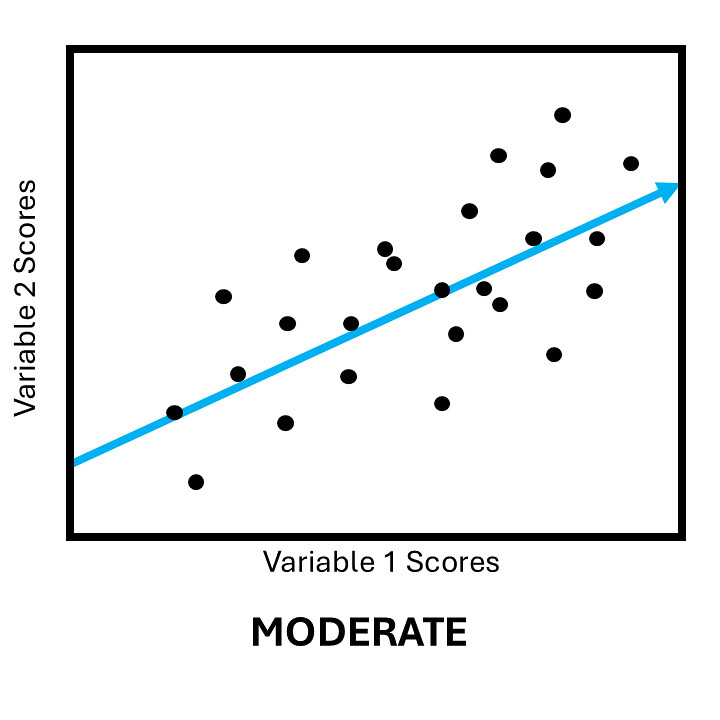
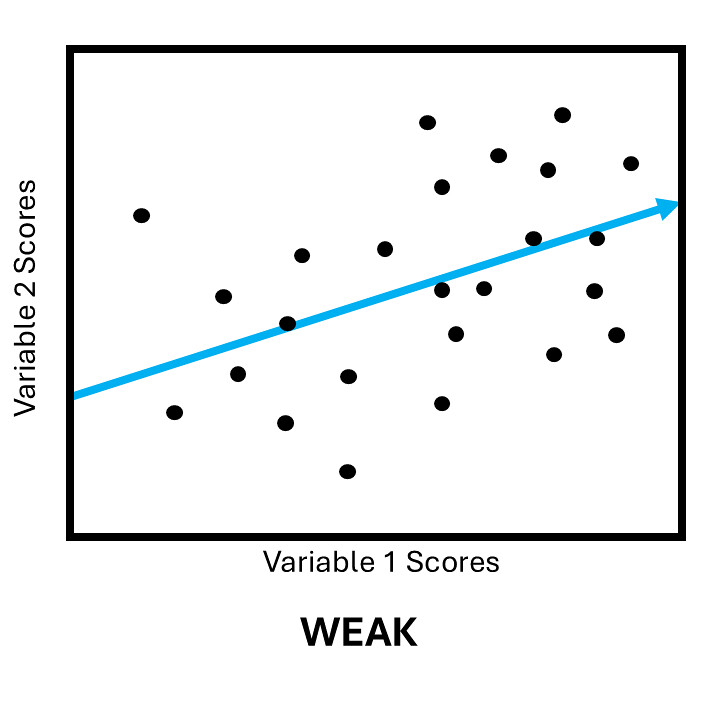
Strength describes how closely the points follow the overall pattern. The closer the points are to the pattern, the stronger the relationship.
| Strength | What to Look For |
|---|---|
| Strong | The points are tightly clustered around the overall pattern. |
| Moderate | The points show a clear pattern, but there is noticeable variation around it. |
| Weak | The points show a slight or inconsistent pattern. |
| No Relationship | The points are scattered without a clear pattern or direction. |
Strength Examples


Step 4: Look for Outliers
An outlier is an observation that is noticeably separated from the overall pattern of the other points. Outliers can occur in either variable and may have a substantial effect on the results of a correlation analysis.
With an Outlier

Outlier Removed

How to Identify an Outlier
- Look for a point that is far away from the other observations.
- Determine whether the point follows the overall pattern.
- Consider whether the point may have a meaningful explanation or may represent an error.
An outlier does not automatically mean that something is wrong with the data. It may represent a legitimate observation that is simply unusual compared with the rest of the sample.
| What You See | What It May Mean |
|---|---|
| Point follows the overall pattern | The observation may be unusual in value but still consistent with the relationship. |
| Point is far from the overall pattern | The observation may be an outlier that could influence the correlation. |
| Several unusual points | The apparent relationship may be more complex than a simple linear pattern. |
Putting It All Together
A complete interpretation of a scatterplot considers form, direction, strength, and outliers.
| Feature | Question to Ask |
|---|---|
| Form | Is the pattern linear or curvilinear? |
| Direction | Is the relationship positive, negative, or does it have no clear direction? |
| Strength | Is the pattern strong, moderate, weak, or absent? |
| Outliers | Are there any observations that fall far from the overall pattern? |